When you travel the country, one of the things you’ll always notice is that how fit and healthy people look on average will vary a lot. And where you live also has a major impact on how likely you are to be able to improve your fitness levels.
Having worked in the fitness industry as a personal trainer for over ten years, I wanted to find out if reliable data could actually back up my own perceptions of the fittest states.
That meant spending a few weeks diving into CDC data and many other sources to find up-to-date information on the healthiest states.
And the results surprised me a lot, especially when it came to the availability of access to gyms.
Quick Summary
- Some of the fittest states include Vermont, Colorado, New Hampshire, Montana, Wisconsin, Minnesota, Maryland, California, North Dakota, and Idaho.
- The states with the least obese people are New York, Hawaii, Vermont, Colorado, and Massachusetts.
- A notable statistic from the Centers For Disease Control (CDC) is that the overall obesity rate in the US is 32%, with no state having a rate under 20%.
- In my view, the correlation between gym availability and fitness levels is intriguing, suggesting that access to fitness facilities significantly impacts overall health and fitness.
The Surprising Facts About Fitness Data
To come up with a list of the fittest states, we decided to focus on six key data points.
We used reliable data to rank all 50 states for each of these data points and then assigned a score based on the ranking.
Let me show you the data we used.
1. What’s Up With Adult Obesity?
Background
The Centers For Disease Control (CDC) maintains data on overall obesity levels for each state based on body mass index (BMI) [1]. The overall obesity rate for the entire country is 32%, and no state has a rate under 20%.
With obesity rates being a critical indicator of overall health and fitness levels, this was the first point of data we collected.
Results
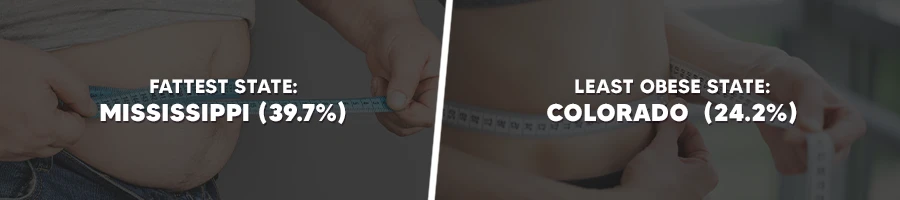
Based on the information provided by the CDC, we identified these as the five fattest states:
- Mississippi (39.7%)
- West Virginia (39.1%)
- Alabama (39%)
- Louisiana (38.1%)
- Indiana (36.8%)
And the five least obese states are:
- Colorado (24.2%)
- Massachusetts (24.4%)
- Hawaii (24.5%)
- New York (26.3%)
- Vermont (26.5%)
Context
Comparing these data points to the overall fitness ranking highlighted an interesting point.
Only three of the five least obese states were on the overall top 10 fittest states. But all five of the most obese states were in the lowest 12 for the overall fit score.
So there is a definite correlation between obesity and low fitness levels, but there is more to achieving a great overall fitness score than just achieving a lower BMI.
2. Is Health Club Availability The Cart Or The Horse?

Background
Statistics about health club availability are a good indicator of the overall interest in staying fit.
To figure this out, we used statistics about the number of health clubs in each state and then weighted that data against the population size of the state [2].
Results
The five states with the lowest availability of gyms and other health and fitness businesses:
- West Virginia (8.26 per 100k population)
- Utah (9.36 per 100k population)
- Kentucky (9.51 per 100k population)
- Hawaii (9.96 per 100k population)
- Mississippi (10.38 per 100k population)
The five states with the highest availability of health clubs:
- Montana (19.18 per 100k population)
- Connecticut (19.02 per 100k population)
- Vermont (16.51 per 100k population)
- Massachusetts (16.37 per 100k population)
- New Jersey (15.74 per 100k population)
Context
The data shows a clear trend: states with more fitness clubs tend to have lower obesity rates and higher fit scores. For instance, Montana, the top state for health clubs, boasts double the number per capita compared to West Virginia, which ranks lowest.
But here's the catch: does a keen interest in fitness boost the number of gyms, or do more gyms encourage better fitness? It's a classic chicken-and-egg dilemma, open to endless debate.
Another factor is gym affordability. States ranking low in fitness often have lower average incomes, suggesting that gym expenses might take a backseat to other financial priorities.
3. Fast Food And Fitness Don’t Work Out

Background
One of the biggest temptations and barriers to getting and staying fit all comes down to what people eat. And the more tempting it is to resort to eating junk food, the more likely that people go down a slippery slope of eating bad food that makes them fat and sick.
For this analysis, we used statistics from 2021 that had an accurate count of so-called “limited-service restaurants” around the country [3].
Results
These are the states with the highest levels of fast food outlets available per 100,000 population:
- Hawaii (106 per 100k population)
- North Carolina (93 per 100k population)
- Alabama (91 per 100k population)
- Georgia (88 per 100k population)
- Louisiana (87 per 100k population)
Lowest levels of fast food outlets:
- Arizona (59 per 100k population)
- Vermont (60 per 100k population)
- Alaska (60 per 100k population)
- Michigan (61 per 100k population)
- Wyoming (61 per 100k population)
Context
Not surprisingly, junk food temptation seems to directly correlate to obesity and overall fitness levels.
It’s one of the stand-out data points for the fittest state in the country, Vermont, which also has the second-lowest concentration of fast food outlets.
According to the National Institute of Health (NIH), cheap and crap food with low nutritional value has become an increasing threat to health since the Covid pandemic, and it’s increasingly affecting young people [4].
4. Reported Days Of Poor Health Directly Ties To Fitness
Background
The United Health Foundation tracks data about how people rate the number of days they have encountered poor health in the past month. Reporting larger numbers of days where people felt sick has a significant impact on overall health.
And it’s important to understand the correlation to other data points like obesity and overall fitness.
health insurance
Results
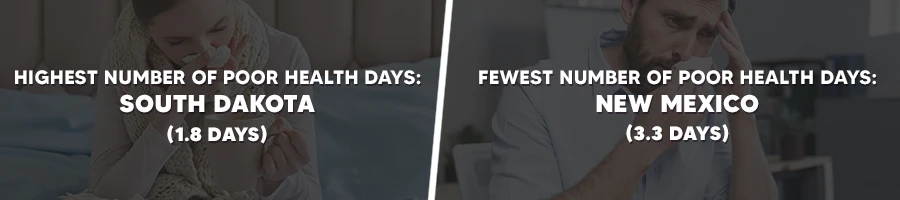
These are the five states with the highest number of poor health days:
- South Dakota (1.8 days)
- Iowa (2 days)
- Nebraska (2 days)
- New Hampshire (2 days)
- Wisconsin (2.1 days)
And here are the five states that reported the fewest number of poor health days:
- New Mexico (3.3 days)
- Alaska (3.1 days)
- Nevada (3.1 days)
- Alabama (3.1 days)
- Oregon (2.8 days
Context
The differences here are quite staggering. Residents of New Mexico report, on average, almost twice as many days of poor health as the residents of South Dakota.
But when you look a bit closer at those rankings, you’ll notice something significant.
Self-rated poor health days don’t have a very strong correlation to the overall fitness levels.
Most of the top and bottom five states in this category are right around the middle range of overall fitness (Nebraska, Oregon, South Dakota, Iowa, New Mexico, Alaska).
This could be a significant indication that people lack critical knowledge and understanding of health and fitness indicators to accurately assess their own fitness levels.
5. Unfit People Have Very High Levels of Inactivity
Background
Another important factor for our overall fitness and health score is the amount of exercises people are getting. It’s one thing having lots of gyms available with people joining them.
But unless they are actually active on a regular basis, it doesn’t count for much.
To analyze this, we looked at CDC data based on whether people did any physical activity other than their regular work in the last month [5].
Results
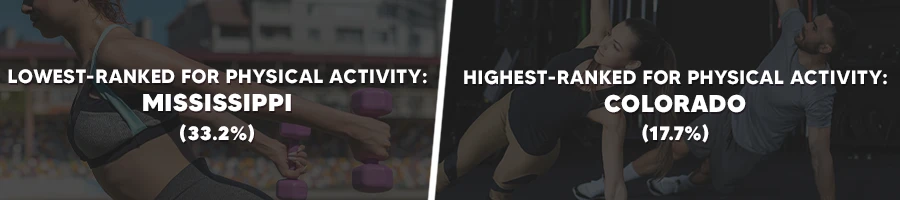
Here are the lowest-ranked states for physical activity:
- Mississippi (33.2%)
- Kentucky (32.5%)
- Arkansas (31.1%)
- Louisiana (30.8%)
- Alabama (30.7%)
And the highest-ranked states had considerably better data:
- Colorado (17.7%)
- Utah (18.2%)
- Washington (18.4%)
- Vermont (19.6%)
- Oregon (20.7%)
Context
This is where there really weren’t any surprises.
First of all, the state with the highest levels of inactivity (Mississippi) has twice the amount of inactivity as the most active state (Colorado).
What else is interesting about these states?
Colorado is the second fittest state in the country, while Mississippi is the least fit.
Also, all of the five states with the lowest levels of activity on a monthly basis are in the bottom 20% for overall fitness. That shows how important regular exercise at home, outdoors, and at the home gym is for overall health and fitness.
6. Self Rated Excellent Health
Background
The final input value for our health score is the self-reported levels of excellent health. People are asked how they would rate their overall health and given the option of poor, fair, good, very good, and excellent [6].
We focused our research on the excellent health data set in order to identify the overall fittest and healthiest states.
Results
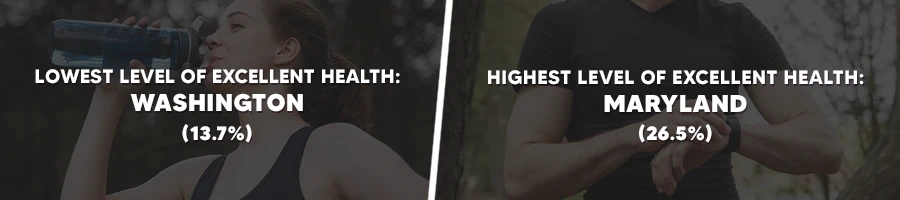
These are the states with the lowest levels of excellent health:
- Washington (13.7%)
- Minnesota (15.2%)
- Kansas (15.6%)
- Ohio (17.2%)
- Arizona (17.6%)
And here are the five states with the highest levels of excellent health:
- Maryland (26.5%)
- New Hampshire (25.7%)
- California (25.2%)
- Colorado (25.1%)
- New Mexico (25.1%)
Context
What stood out for us in this data is that the five states with the highest rate of self-reported excellent health are all in the overall top ten on our fitness list.
But only one state in the overall ranking (Ohio) featured on the list of five worst states for excellent health.
This could indicate that a lack of health and fitness often go hand in hand with a poor understanding of what excellent health actually means.
It could also indicate a problem that people rate their health compared to others around them. And if people with moderately good health see lots of severely unhealthy people, they could be more likely to rate their health a lot better than it actually is.
Impact of Climate and Geography on Fitness Levels
Different climates and geographical features across states significantly influence outdoor activities and fitness levels.
- In states with milder climates, such as California or Florida, consistent weather patterns encourage year-round outdoor exercises like jogging, cycling, and swimming.
- Conversely, states with harsh winters, like Minnesota or Alaska, often see a seasonal shift in activities, with skiing and indoor fitness gaining popularity during colder months.
- Mountainous regions, like Colorado, promote hiking and mountain biking, enhancing cardiovascular health.
- Coastal areas offer water-based activities like surfing and kayaking.
Thus, local geography and climate play crucial roles in shaping the fitness habits and preferences of residents in various states.
What Are The Fittest States?

Here are the overall state rankings based on our health scores:
- Vermont
- Colorado
- New Hampshire
- Montana
- Wisconsin
- Connecticut
- Massachusetts
- Minnesota
- Maryland
- California
- North Dakota
- Idaho
- Wyoming
- Virginia
- Nebraska
- Michigan
- Oregon
- Maine
- South Dakota
- New Jersey
- New Mexico
- Iowa
- Washington
- Alaska
- Pennsylvania
- Texas
- Delaware
- Utah
- Florida
- Arizona
- Kansas
- Hawaii
- South Carolina
- Georgia
- Illinois
- New York
- Missouri
- Louisiana
- North Carolina
- Nevada
- Rhode Island
- Oklahoma
- Tennessee
- Arkansas
- Ohio
- Indiana
- Alabama
- Kentucky
- West Virginia
- Mississippi
FAQs
Which Is the Healthiest State in USA?
Hawaii is the healthiest state in the USA due to its clean air, active lifestyle, fresh local foods, low stress environment, and strong community connections promoting overall well-being.
What State Has the Most People in Shape?
Colorado consistently ranks as the state with the most physically fit residents, due to its outdoor culture and high activity levels among its population.
References:
- https://www.cdc.gov/obesity/data/prevalence-maps.html
- https://www.statista.com/statistics/1183595/health-clubs-by-state/
- https://www.statista.com/statistics/825076/number-of-lsr-s-by-us-state/
- https://www.ncbi.nlm.nih.gov/pmc/articles/PMC8459649/
- https://www.cdc.gov/physicalactivity/data/inactivity-prevalence-maps/index.html#Location
- https://www.kff.org/other/state-indicator/adult-self-reported-health-status/?currentTimeframe=0&sortModel=%7B%22colId%22%3A%22Location%22%2C%22sort%22%3A%22asc%22%7D
About The Author
You May Also Like